
|
Doppler5 Weather |
|
Last update cycle: Start : CT Finish: CT
Page last reloaded: Update cycle runs at 7, 22, 37 and 52 minutes past each hour. Page reload every 15 minutes. |
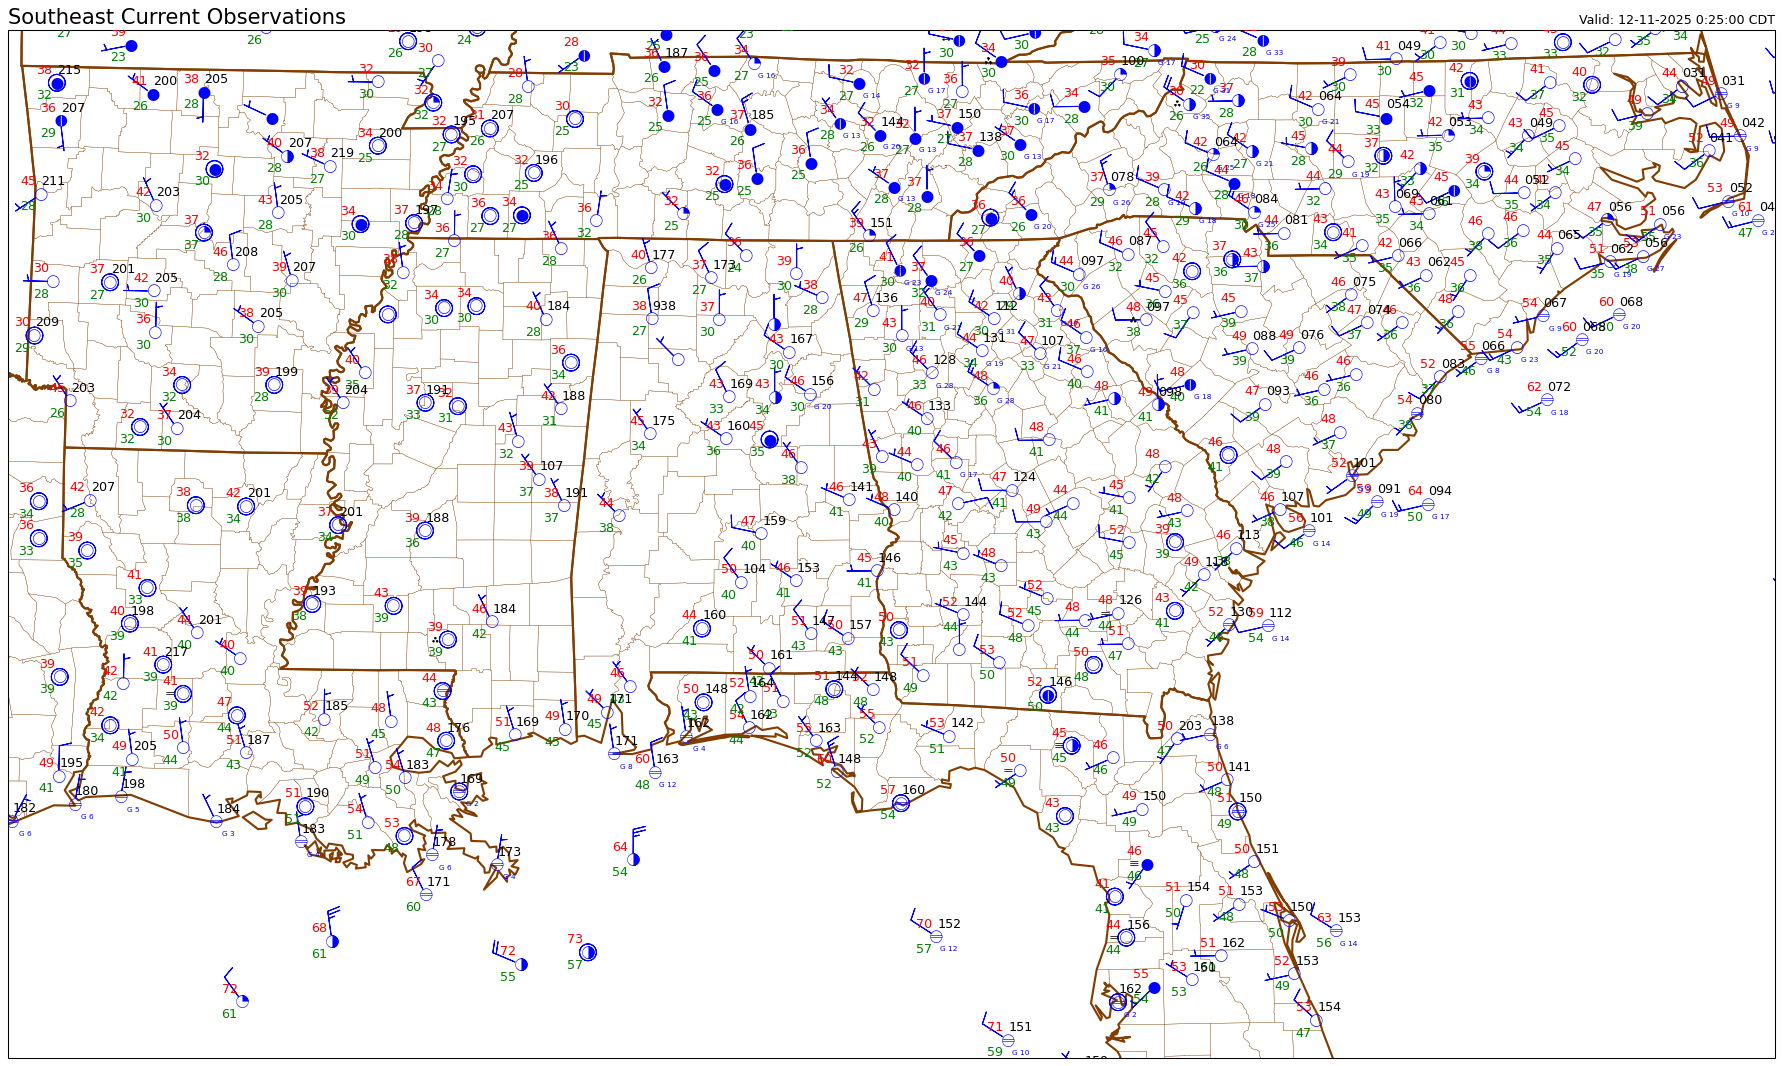
 Automated Weather Analysis in Regional Expanses Surface Analysis System |


| |
|
Experimental Product Viewer Temperature: Air | Water | Apparent | Wet Bulb Globe Temperature | Wet Bulb | Theta Moisture: Dew Point | Relative Humidity | Theta-E | Mixing Ratio Wind: Speed | Gusts | Absolute Vorticity Pressure: Mean Sea Level | Instantaneous Sea Level Obstructions: Visibility | Ceiling Heights | Chart generation and data analysis utilize all available observations from official sources, including National Weather Service (NWS) Automated Surface Observing System (ASOS), Federal Aviation Administration (FAA) Automated Weather Observing System (AWOS), National Oceanic and Atmospheric Administration (NOAA) Coastal-Marine Automated Network (CMAN) sites and National Data Buoy Center (NDBC) offshore buoy platforms. |


